news
Amarillo's No. 2 Economy Surges With Data Center Expansion
The current surge in local building activity follows years of expansion across meatpacking, renewable energy and defense work that earned the city its No. 2 national ranking among midsize economies.
How we reported this
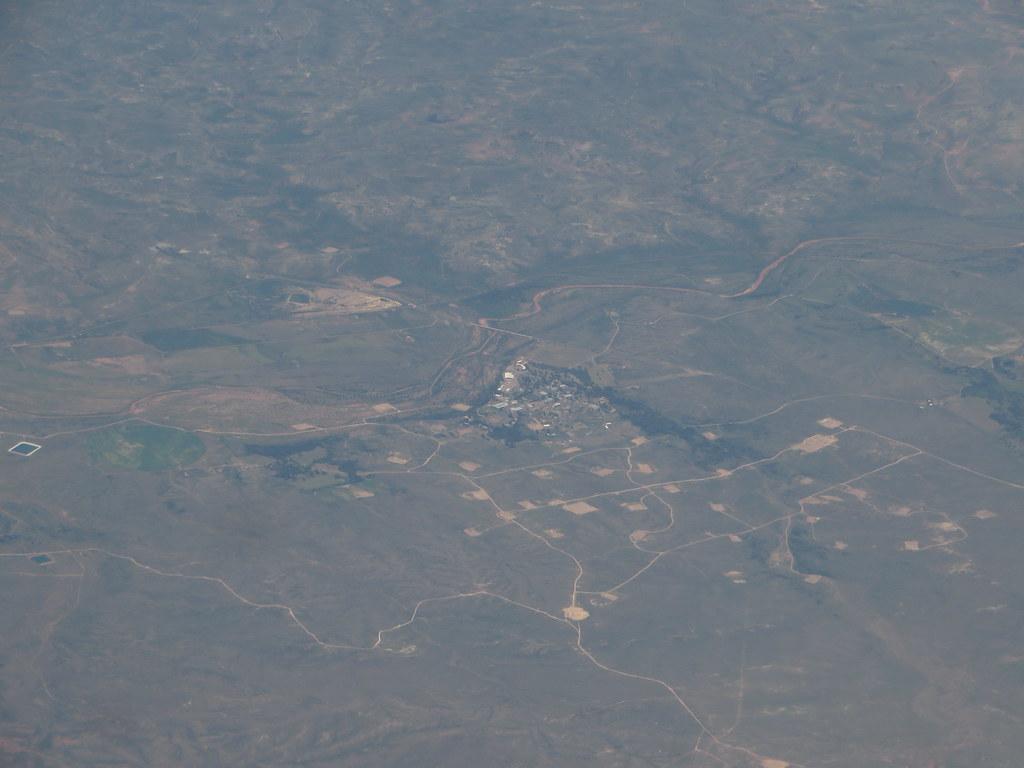
Construction activity in Amarillo jumped 160 percent in April compared with the same month a year earlier, while residential starts rose 208 percent over the same period, according to figures compiled for the local economy analysis at anb.com. Those increases trace directly to data center projects now underway and mark the latest stage in a growth sequence that began with the city’s 2023 recognition as the second-fastest-growing midsize economy in the United States.
Path from 2023 ranking to present activity
Amarillo earned that 2023 ranking because of steady expansion in meatpacking, renewable energy and defense contracting, sectors that together supported employment of roughly 136,512 workers and kept the local unemployment rate at 3.7 percent, below the statewide Texas figure of 4.4 percent. The same industries supplied the tax base and labor pool that later attracted data center developers, turning earlier gains into the sharp construction increases recorded this spring.
The city continues to anchor a regional trade area of more than 500,000 residents across the Texas Panhandle, eastern New Mexico and the Oklahoma Panhandle. Retail sales have risen 12 percent from twelve months ago, new-car sales have climbed 32 percent and used-car sales have increased 48 percent, numbers that reflect the same consumer strength built on those established industries.
Employment and sales figures show continuity
Employment totals and the unemployment rate have remained stable while construction metrics accelerated, indicating that the data center work layered onto an already diversified base rather than replacing it. The 2023 ranking reflected measurable output across the three core sectors, and the current building statistics show how that output translated into physical development once large-scale projects arrived.
Businesses and residents tracking these trends can review monthly permit data released by the city and compare them against the employment and sales benchmarks already published in the local economic analysis to gauge whether the pattern of layered growth holds through the rest of the year.